

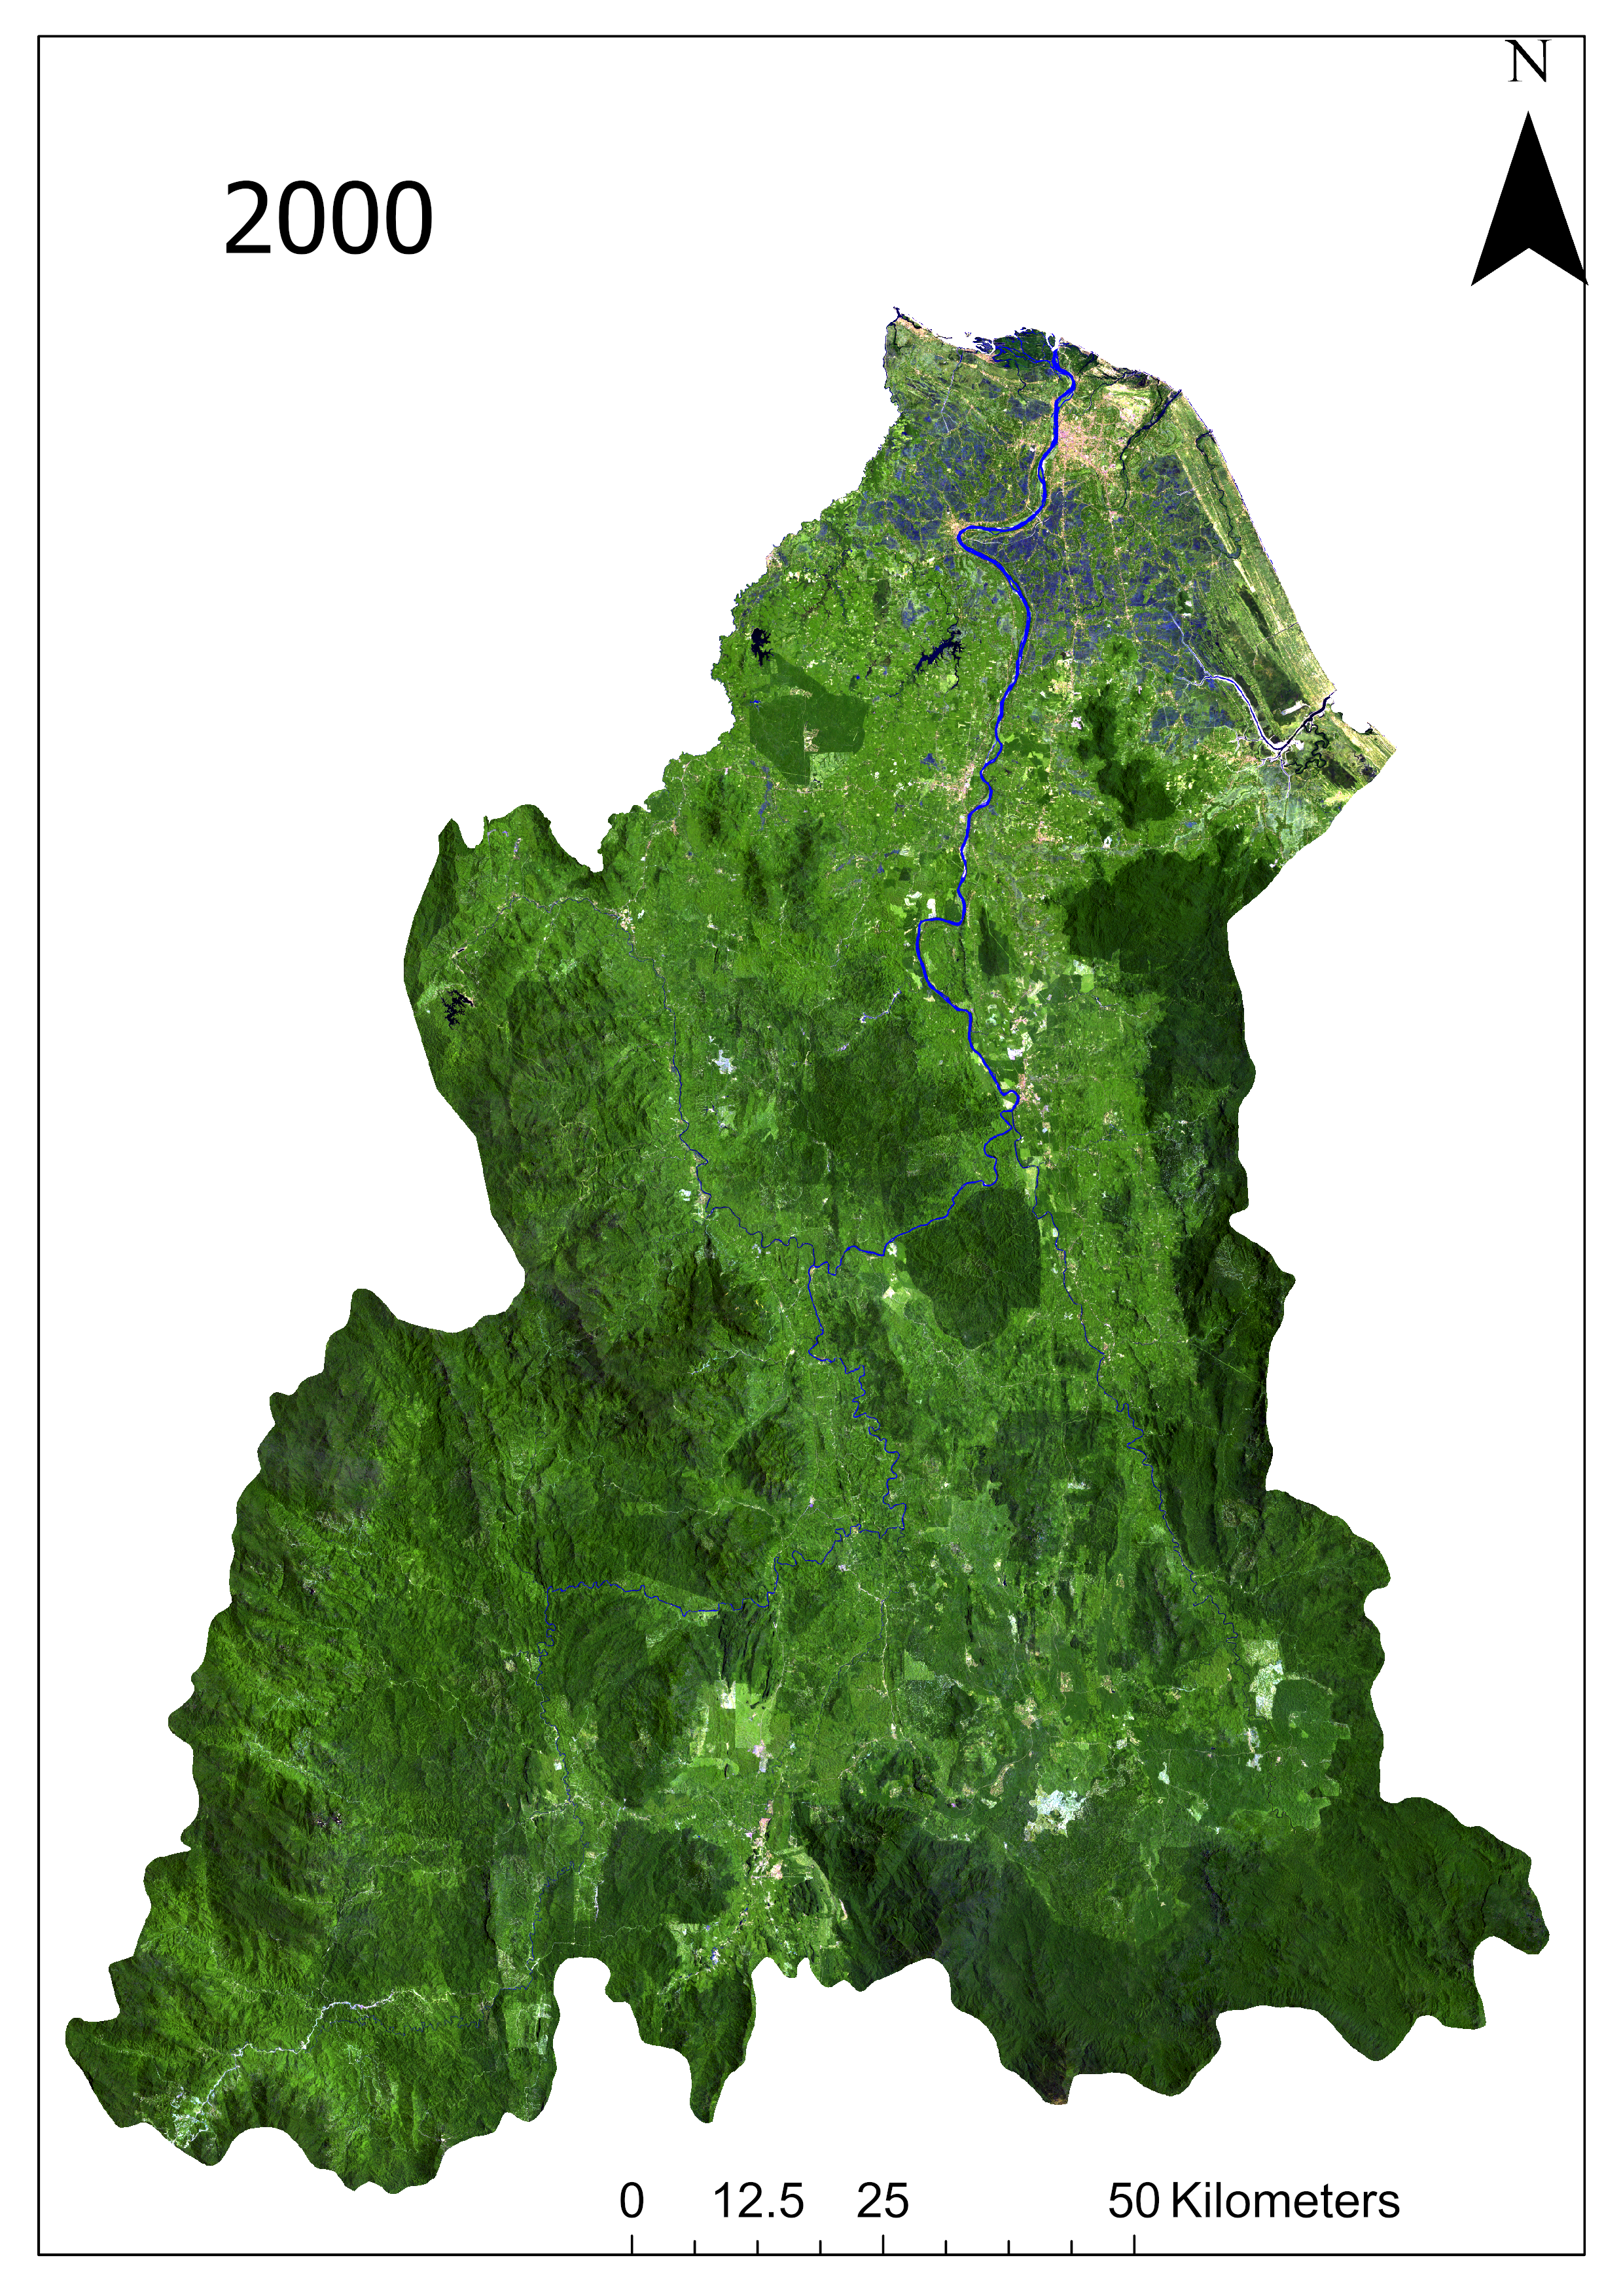


Figure 1- Satellite imagery of Kelantan from 1990 to 2020, displayed in false colour SWIR bands.
Large deforestation trends for the past 30 years

Green indicates areas where forest cover change is little to none, while white and purple indicate increasing levels of forest cover change(Figure 3). Deforestation has been most prominent in the eastern and central district of Kelantan, where PFR and ESA level-1 area logging restrictions have been ignored. Northern regions consist mainly of developed urban areas.

Can you log in reserves?
The National Forestry Act 1984 requires all State Forestry Departments to manage and protect Permanent Forest Reserves or Estates(PFR), sustainably for timber products(Figure 4). To extract timber from PFRs, logging operators must obtain a valid license, which is subject to environmental impact assessment reports per the Environmental Quality Act 1974 and the approval of State Forestry Departments. Logging is prohibited in National Parks. State land forests are subject to the State government’s purview and they are not protected by the National Forestry Act 1984.

Can you log in environmentally sensitive areas?
Environmentally sensitive areas(ESAs) are classified into three different priority levels based on indicators for disaster risk, life support values, and heritage values of a site(Figure 5). Malaysia’s Third National Physical Plan prohibits all forms of development for areas classified as ESA Level-1. ESA Level-2 areas allow limited deforestation while ESA Level-3 areas allow for industrial development under strict environmental regulations(TCPD, 2015).

Future projections if we protect protected areas
Immediately stopping deforestation AND facilitating re-forestation is the best course of action for our environment. Using geospatial analysis, three scenarios for 2025 are projected to anticipate immediate action by the Kelantan government to protect our remaining forests.
- No deforestation in PFRs only(Figure 6)
- No deforestation in PFRs and ESA Level-1 only(Figure 7)
- Business-as-usual(Figure 8)
By manipulating the spectral reflectance values of the trend map, re-forestation in protected areas are simulated either by allowing natural regrowth or active replanting along the edges of remaining intact forests. Scenario 1 and 2 showed increasing patches of green within delineated PFR and ESA Level-1 areas, but not sufficient to regain significant forest cover in the eastern district. The business-as-usual scenario showed continued deforestation along the edges of remnant forest patches. Even in the best possible scenario where all applicable policies are in force, deforestation is very difficult to be reversed in PFRs and ESA Level-1 areas in the near-term. Active decision-making must be taken to revoke controversial logging licenses and re-forest logged areas.


Figure 7(center)- No deforestation in PFRs and ESA Level-1 by 2025
Figure 8(bottom)- Business-as-usual deforestation by 2025
Methods
Landsat 8 OLI/TRS and Landsat 5 ETM Surface Reflectance imagery of Kelantan is collected from Google Earth Engine(Gorelick et al., 2017). Images taken within the years 1990, 1995, 2000, 2005, 2010, 2015, and 2020 are combined and corrected for cloud cover and atmospheric distortions. All images have a 30m spatial resolution. PFR and ESA maps are extracted from Malaysia’s Third National Physical Plan dated in 2015(TCPD, 2015) and geo-processed as clipping polygons.
32-bit shortwave infrared(SWIR) bands(Band 7 for Landsat 5 and 8) are extracted and geo-processed into a multidimensional raster. The SWIR band is found to be excellent at distinguishing forests from other land use classes and is even able to distinguish between tree species(Ferreira et al., 2019). Based on spectral profile analysis of an image of Kelantan in 2020, primary forests, plantations, water bodies, and bare soil/urban areas can be clearly distinguished based on the SWIR band(Figure 1). Increasing raster digital number(DN) values of a pixel indicate change from primary forest to developed land uses.
The generate trend raster function from ArcGIS Pro(Esri Inc., 2021) is used to run a linear regression for the pixel values in the map. Results of the regression show very small R2 values(mean R2=0.01249, p=0.7691, where p<0.05), which can be interpreted as an equivalent of no change in trends. Root mean square error(RMSE) for the DN values(mean=338.0) is used instead as an indicator of how much the pixel values deviate from having no change(Figure 4).
The predict using the trend raster function and the raster calculator from ArcGIS Pro(Esri Inc., 2021) is used for the scenario projections. A default projection raster for the year 2025 is created based on the trend raster and is used for the scenario calculations. For scenario 1(Figure 5), DN values more than 250 within PFR areas are deducted by 50 to simulate natural regrowth and reforestation efforts. For scenario 2(Figure 6), DN values more than 250 within PFR and ESA Level-1 areas are deducted by 50. For scenario 3(Figure 7), DN values between 300-400 are increased by 50 disregarding delineations of either PFR or ESA Level-1. Pixels that occur within the 300-400 range mostly occur in remnant or isolated patches near the edges of remaining forests, therefore they represent forest edge logging. The values chosen for the calculations are derived from observations of the trend raster results.
Limitations
The accuracy of satellite imagery is limited by the patches of distortions and null values created by the cloud cover removal function form GEE. The metric used to identify primary forest conversion assumes plantations and bare soil have different tree cover density compared to primary forests. The linear trend over 30 years oversimplified and failed to account for plantation regrowth and harvesting seasons that can occur for several cycles within a 5-year interval. Scenario projection criteria and assumptions are subjective based on observations on results and therefore should be validated by further ground testing. Projections solely based on raster value changes over 30 years fail to capture the human dynamics of logging concessions and licensing operations that cannot be explained by assuming logging only ensues around forest edges.
____
Bryan Yong,
University of Nottingham Malaysia
23rd March 2021
1004 words
References
C4 Center (2016) An Insight into the Kelantan Logging Industry. Available at: https://www.cfourconsultanciessdnbhd.com/main/c4center.org/insight-kelantan-timber-industry.html.
Environmental Quality Act 1974(Malaysia) (2006). Putrajaya: Attorney General’s Chambers of Malaysia. Available at: http://www.agc.gov.my/agcportal/uploads/files/Publications/LOM/EN/Act 127.pdf.
Esri Inc. (2021) ArcGIS Pro (Version2.7.1), Esri Inc. Available at: https://www.esri.com/en-us/arcgis/products/arcgis-pro/overview.
Ferreira, M. P. et al. (2019) ‘Tree species classification in tropical forests using visible to shortwave infrared WorldView-3 images and texture analysis’, ISPRS Journal of Photogrammetry and Remote Sensing, 149, pp. 119–131. doi: https://doi.org/10.1016/j.isprsjprs.2019.01.019.
Gorelick, N. et al. (2017) ‘Google Earth Engine: Planetary-scale geospatial analysis for everyone’, Remote Sensing of Environment, 202, pp. 18–27. doi: https://doi.org/10.1016/j.rse.2017.06.031.
National Forestry Act 1984(Malaysia) (2006). Putrajaya: Attorney General’s Chambers of Malaysia. Available at: http://www.agc.gov.my/agcportal/uploads/files/Publications/LOM/EN/Act 313.pdf.
TCPD (2015) National Physical Plan 3(translated from Bahasa Malaysia). Kuala Lumpur. Available at: https://www.melaka.gov.my/ms/koleksi-media/penerbitan/lain-lain/lampiran-ll/rancangan-fizikal-negara-ke-3-rfn3.


